Note
Go to the end to download the full example code.
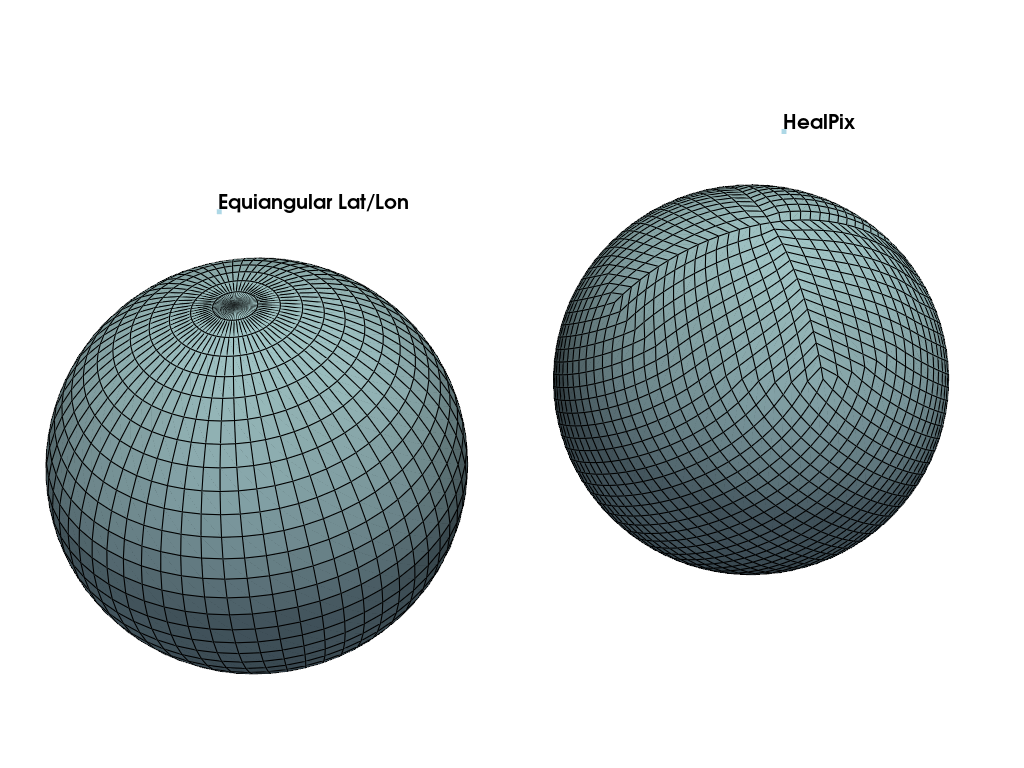
Plot grids with PyVista#
import pyvista as pv
import earth2grid


def label(mesh, plotter, text):
    """
    Add a label above a mesh in a PyVista plot.

    Parameters:
    - mesh: The mesh to label.
    - plotter: A PyVista plotter instance.
    - text: The label text.
    - color: The color of the text label. Default is 'white'.
    """
    # Calculate the center of the mesh and the top Z-coordinate plus an offset
    center = mesh.center
    label_pos = [center[0], center[1], mesh.bounds[5] + 0.5]  # Offset to place label above the mesh

    # Add the label using point labels for precise 3D positioning
    plotter.add_point_labels(
        [label_pos], [text], point_size=0, render_points_as_spheres=False, shape_opacity=0, font_size=20
    )


grid = earth2grid.healpix.Grid(level=4)
hpx = grid.to_pyvista()
latlon = earth2grid.latlon.equiangular_lat_lon_grid(32, 64, includes_south_pole=False).to_pyvista()


pl = pv.Plotter()
mesh = hpx.translate([0, 2.5, 0])
pl.add_mesh(mesh, show_edges=True)
label(mesh, pl, "HealPix")

pl.add_mesh(latlon, show_edges=True)
label(latlon, pl, "Equiangular Lat/Lon")

pl.camera.position = (5, 0, 5)
pl.show()

[ -2.8125   2.8125   8.4375  14.0625  19.6875  25.3125  30.9375  36.5625
  42.1875  47.8125  53.4375  59.0625  64.6875  70.3125  75.9375  81.5625
  87.1875  92.8125  98.4375 104.0625 109.6875 115.3125 120.9375 126.5625
 132.1875 137.8125 143.4375 149.0625 154.6875 160.3125 165.9375 171.5625
 177.1875 182.8125 188.4375 194.0625 199.6875 205.3125 210.9375 216.5625
 222.1875 227.8125 233.4375 239.0625 244.6875 250.3125 255.9375 261.5625
 267.1875 272.8125 278.4375 284.0625 289.6875 295.3125 300.9375 306.5625
 312.1875 317.8125 323.4375 329.0625 334.6875 340.3125 345.9375 351.5625
 357.1875]
Total running time of the script: (0 minutes 1.772 seconds)