Note
Go to the end to download the full example code.
Working with HEALPix Grids and Local Patches#
This example demonstrates how to work with HEALPix grids and extract local patches around specific points on the sphere. We’ll show:
Creating a HEALPix grid
Generating example data on the sphere
Extracting a local patch around a point
Visualizing both global and local data
Note that the patch can cover multiple HEALPix faces.
The example uses a combination of HEALPix operations and Cartopy for visualization.
import matplotlib.pyplot as plt
import torch
import cartopy.crs
import numpy as np
from earth2grid.healpix import XY, Grid
from earth2grid import healpix
from earth2grid.healpix_bare import ang2pix
from earth2grid.spatial import ang2vec
from earth2grid.healpix import local2xy, ring2xy
from earth2grid import latlon
VMIN = -2
VMAX = 2
CMAP = 'viridis'
PROJECTION = cartopy.crs.NorthPolarStereo()
def create_healpix_grid(order):
"""Create a HEALPix grid of specified order."""
nside = 2**order
grid = Grid(order, pixel_order=XY())
return grid, torch.from_numpy(grid.lat), torch.from_numpy(grid.lon)
def generate_example_data(lon, lat):
"""Generate example data on the sphere using spherical harmonics."""
x, y, z = ang2vec(lon.deg2rad(), lat.deg2rad())
return torch.cos(x + 3 * y) ** 5 + 0.5 * torch.sin(10 * (z - y))
def extract_local_patch(nside, lon0, lat0, pad):
"""Extract a local patch of pixels around the specified point."""
# Convert target point to pixel index
i = ang2pix(nside, torch.tensor([lon0]), torch.tensor([lat0]), lonlat=True)
origin = ring2xy(nside, i)
x0 = origin % nside
y0 = (origin % nside**2) // nside
face0 = origin // (nside**2)
# Create offset grid
dx = torch.arange(-pad, pad)
dy = torch.arange(-pad, pad)
dy, dx = torch.meshgrid(dy, dx, indexing="ij")
# Get local coordinates
x, y, f = local2xy(nside, x0 + dx, y0 + dy, face0)
# Convert to pixel indices
pix = torch.where(f < 12, nside**2 * f + nside * y + x, -1)
return pix
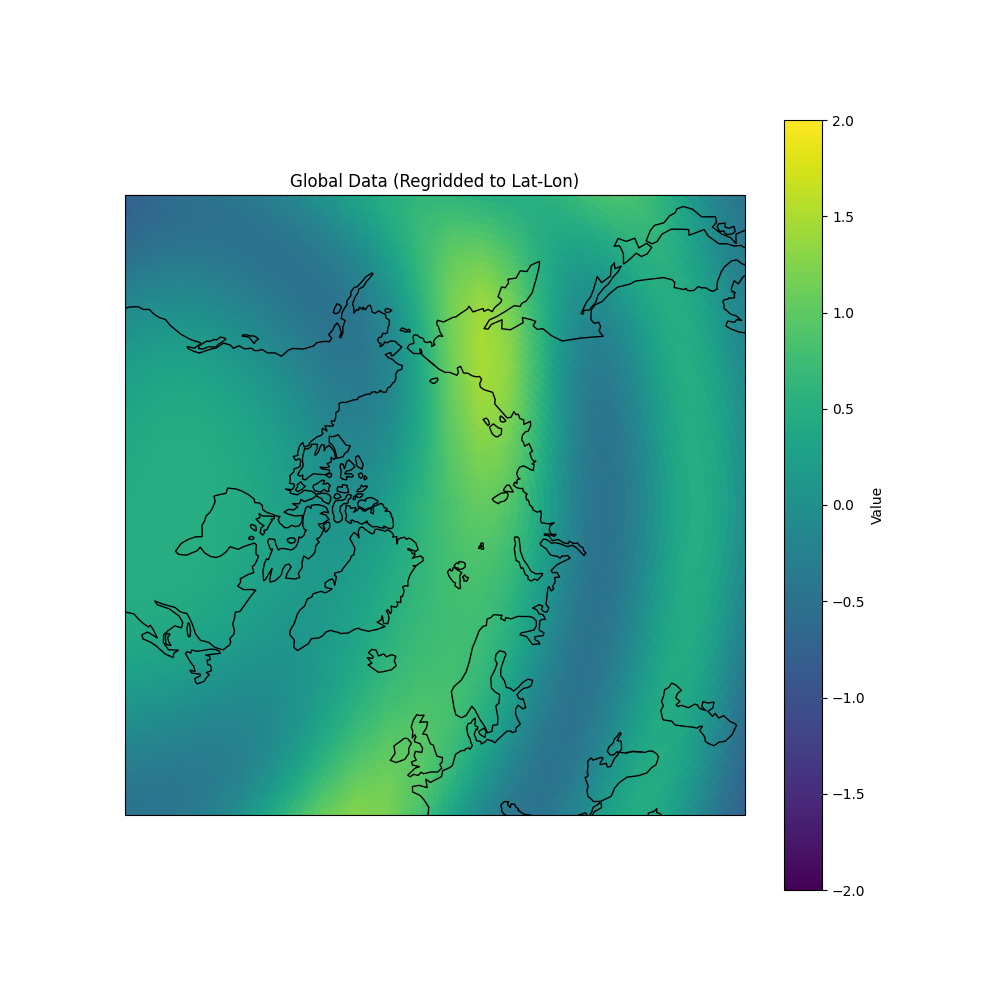
def plot_global_data(grid, z, lon0, lat0):
"""Plot the global data in HEALPix RING ordering."""
# Create a regular lat-lon grid
import earth2grid
nlat, nlon = 180, 360 # 1-degree resolution
latlon_grid = latlon.equiangular_lat_lon_grid(nlat, nlon)
# Create regridder from HEALPix to lat-lon
regridder = earth2grid.get_regridder(grid, latlon_grid)
# Regrid the data
z_regridded = regridder(z)
fig = plt.figure(figsize=(10, 10))
ax = plt.subplot(projection=cartopy.crs.NorthPolarStereo())
# Set the extent to show from pole to 45 degrees latitude
ax.set_extent([-180, 180, 45, 90], crs=cartopy.crs.PlateCarree())
# Plot the regridded data
plt.pcolormesh(
latlon_grid.lon,
latlon_grid.lat,
z_regridded,
transform=cartopy.crs.PlateCarree(),
cmap=CMAP,
vmin=VMIN,
vmax=VMAX,
)
ax.coastlines()
plt.colorbar(label='Value')
plt.title('Global Data (Regridded to Lat-Lon)')
plt.show()
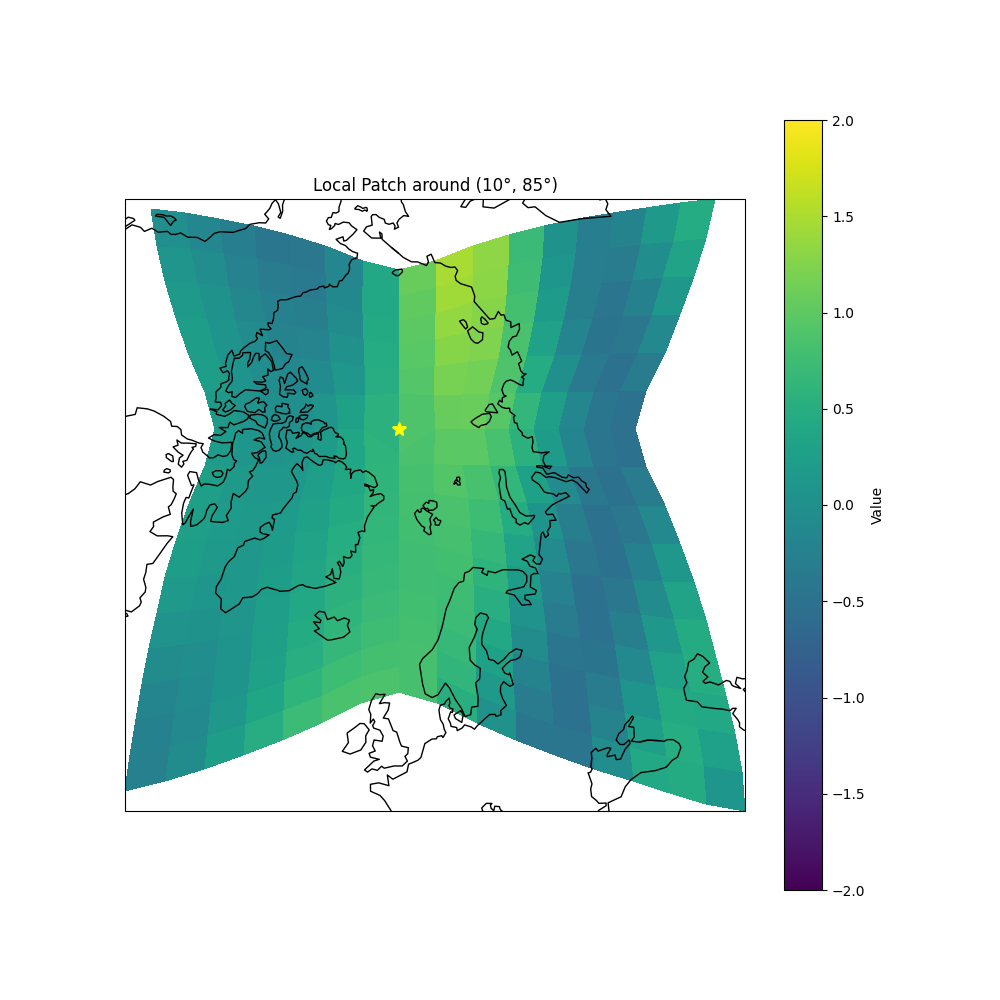
def plot_local_patch(lon, lat, z, pix, lon0, lat0):
"""Plot a local patch of data using Cartopy."""
fig = plt.figure(figsize=(10, 10))
ax = plt.subplot(projection=PROJECTION)
plt.pcolormesh(lon[pix], lat[pix], z[pix], transform=cartopy.crs.PlateCarree(), cmap=CMAP, vmin=VMIN, vmax=VMAX)
# Mark the center point
ax.plot(lon0, lat0, marker="*", markersize=10.0, color='yellow')
ax.coastlines()
plt.colorbar(label='Value')
plt.title(f'Local Patch around ({lon0}°, {lat0}°)')
plt.show()
def main():
"""Run the example demonstrating HEALPix grid operations."""
# Set up grid parameters
order = 4
nside = 2**order
pad = nside // 2 # Size of local patch
# Create grid and get coordinates
grid, lat, lon = create_healpix_grid(order)
# Generate example data
z = generate_example_data(lon, lat)
# Choose a point of interest
lon0, lat0 = 10, 85 # Example point in northern hemisphere
# Extract local patch
pix = extract_local_patch(nside, lon0, lat0, pad)
# Visualize results
plot_global_data(grid, z, lon0, lat0)
plot_local_patch(lon, lat, z, pix, lon0, lat0)
if __name__ == "__main__":
main()
Total running time of the script: (0 minutes 0.982 seconds)