Open Loop Evaluation#
Open loop evaluation allows you to visualize datasets and test model predictions on recorded demonstration data. This is useful for debugging, understanding model behavior, and validating performance before closed loop testing.
Prerequisites#
Make sure you have set up mindmap and are inside the interactive Docker container.
Obtain a dataset by either:
Obtain a trained model by either:
Running Open Loop Evaluation#
Run open loop evaluation for your chosen task:
torchrun_local run_open_loop_policy.py \
    --task cube_stacking \
    --data_type rgbd_and_mesh \
    --feature_type radio_v25_b \
    --checkpoint <LOCAL_CHECKPOINT_PATH>/best.pth \
    --demos_open_loop 0 \
    --dataset <LOCAL_DATASET_PATH>
torchrun_local run_open_loop_policy.py \
    --task mug_in_drawer \
    --data_type rgbd_and_mesh \
    --feature_type radio_v25_b \
    --checkpoint <LOCAL_CHECKPOINT_PATH>/best.pth \
    --demos_open_loop 0 \
    --dataset <LOCAL_DATASET_PATH>
torchrun_local run_open_loop_policy.py \
    --task drill_in_box \
    --data_type rgbd_and_mesh \
    --feature_type radio_v25_b \
    --checkpoint <LOCAL_CHECKPOINT_PATH>/best.pth \
    --demos_open_loop 0 \
    --dataset <LOCAL_DATASET_PATH>
torchrun_local run_open_loop_policy.py \
    --task stick_in_bin \
    --data_type rgbd_and_mesh \
    --feature_type radio_v25_b \
    --checkpoint <LOCAL_CHECKPOINT_PATH>/best.pth \
    --demos_open_loop 0 \
    --dataset <LOCAL_DATASET_PATH>
Note
Update the --demos_open_loop argument to visualize different demonstrations.
Make sure you have the corresponding demo in the dataset.
Note
Replace <LOCAL_DATASET_PATH> with your dataset directory path
and <LOCAL_CHECKPOINT_PATH> with your checkpoint directory path.
Note
To visualize the dataset without running model inference, simply omit the --checkpoint argument.
Note
The --only_sample_keyposes argument can be used to only run predictions and visualizations for the keyposes of the dataset.
This is useful to avoid having to step through every sample of the dataset.
Interactive Visualization#
After running the command, multiple visualization windows will open (see Visualization Examples below). To navigate through the data:
Select a 3D window by clicking on it
Press space to iterate through the dataset
Observe the model’s predictions and spatial memory reconstruction
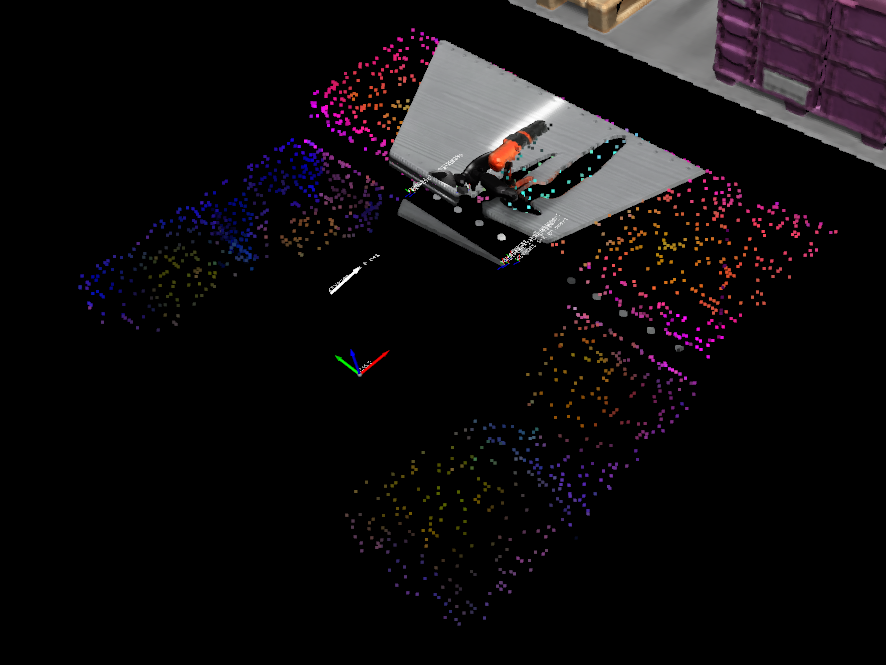
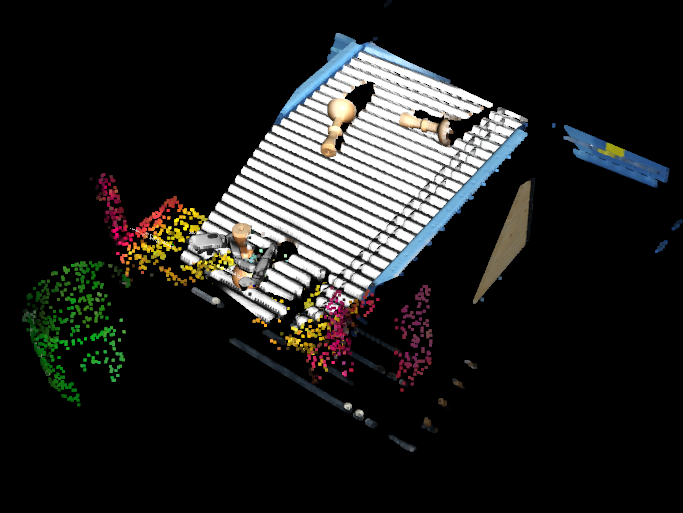
Visualization Examples#
The following examples show the expected visualizations for each task:
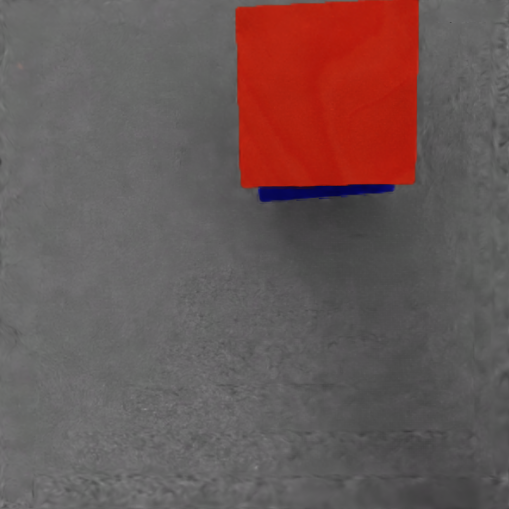

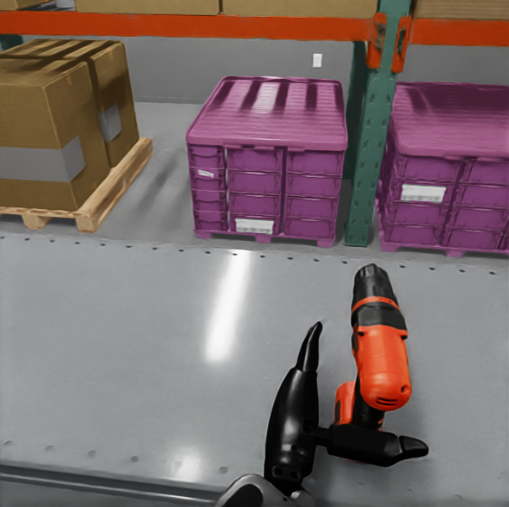
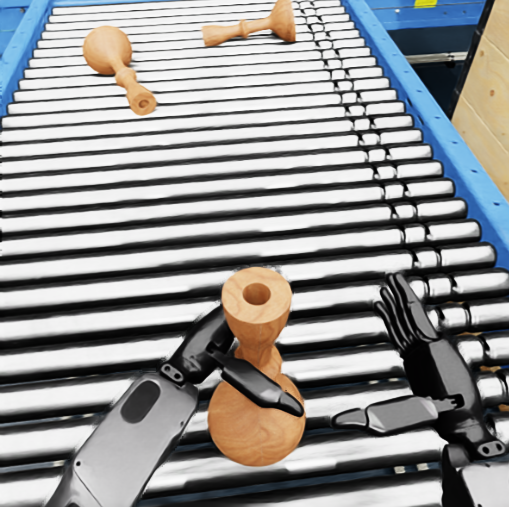
On the left column, the RGB ego-camera view is shown.
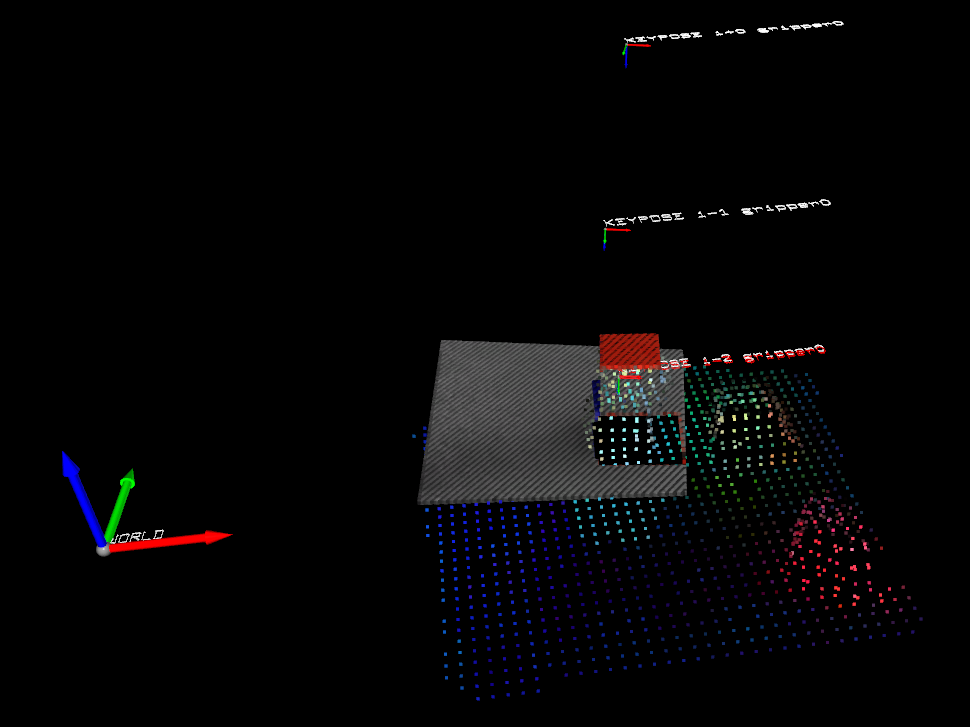
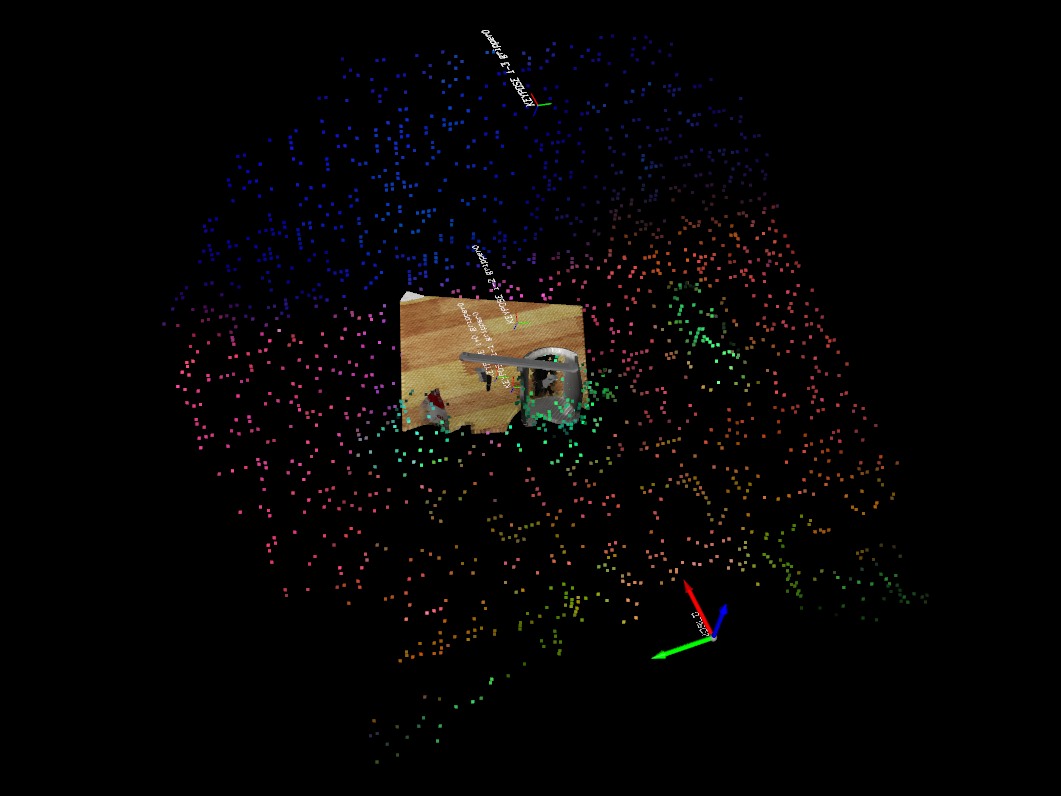
On the right column, the Model Inputs and Prediction window shows the 3D visualization of the model’s inputs and prediction:
World Axis: The global coordinate frame
Keypose History: Previous
num_historykeyposes (model input) labeled askeypose i-<history_idx> gripper<gripper_idx>Current RGBD View: Current camera view as a colored point cloud
Feature Map: 3D reconstruction as a vertex feature point cloud (colored by PCA)
Keypose Prediction: Next
prediction_horizonkeyposes predicted by the model (labeled aspredicted i+<prediction_idx> gripper<gripper_idx>) - only shown when using a checkpoint
This visualization is useful for debugging model performance by showing how spatial information is reconstructed and how action predictions are generated from the model inputs.
Note
For more information on parameters choice and available options, see Parameters.