HexGrid#
- class sionna.sys.HexGrid(num_rings: int, cell_radius: float | None = None, cell_height: float = 0.0, isd: float | None = None, center_loc: List[int] | Tuple[int, int] = (0, 0), center_loc_type: str = 'offset', precision: Literal['single', 'double'] | None = None, device: str | None = None)[source]#
Bases:
sionna.phy.block.BlockCreates a hexagonal spiral grid of cells, drops users uniformly at random and computes wraparound distances and base station positions.
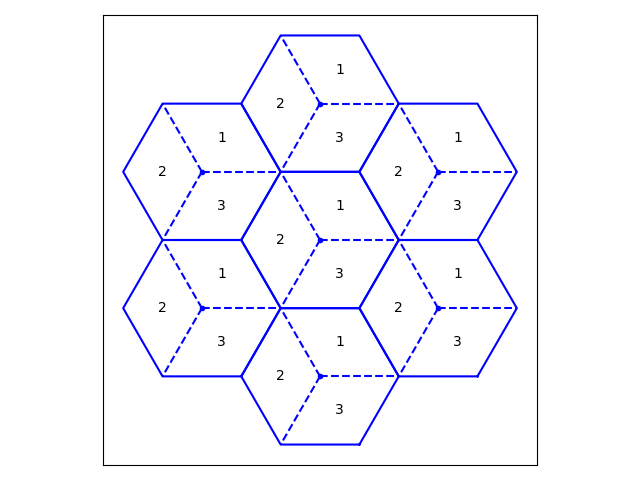
Cell sectors are numbered as follows:
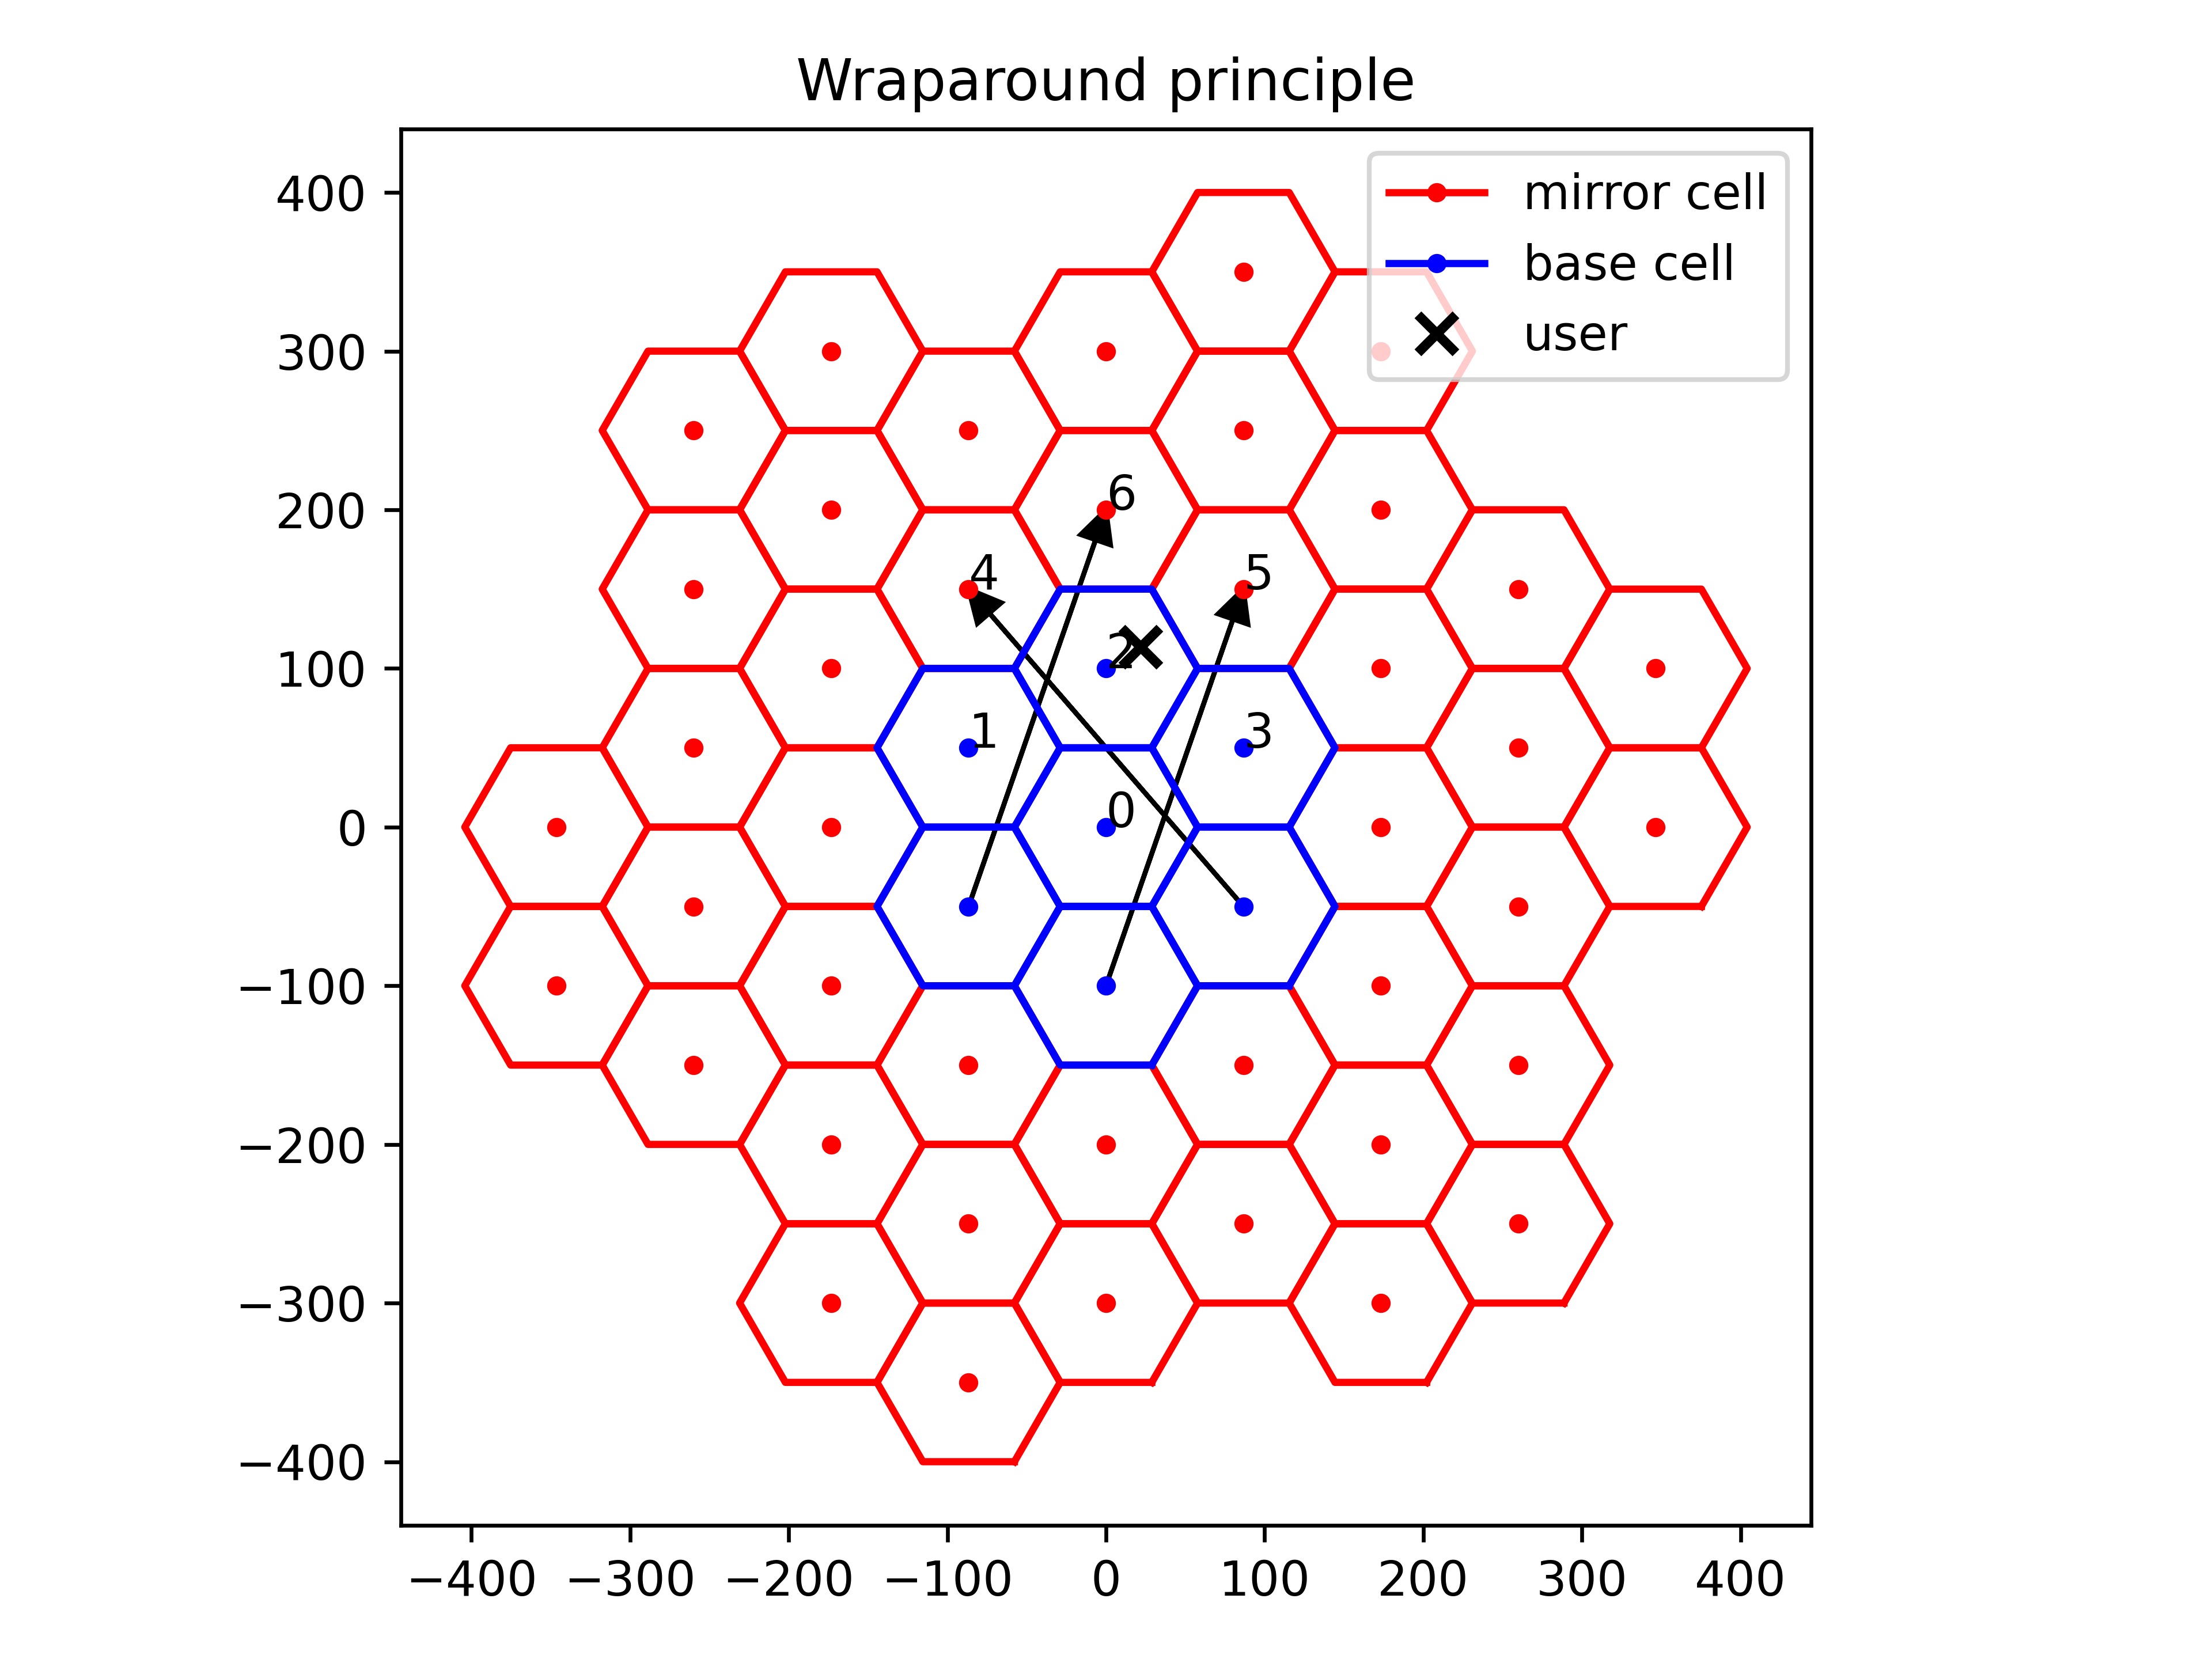
To eliminate border effects that would cause users at the edge of the grid to experience reduced interference, the wraparound principle artificially translates each base station to its closest corresponding “mirror” image in a neighboring hexagon for each user.
- Parameters:
num_rings (int) – Number of spiral rings in the grid
cell_radius (float | None) – Radius of each hexagonal cell in the grid, defined as the distance between the cell center and any of its corners. Either
isdorcell_radiusmust be specified.cell_height (float) – Cell height [m]. Defaults to 0.
isd (float | None) – Inter-site distance. Either
isdorcell_radiusmust be specified.center_loc (List[int] | Tuple[int, int]) – Coordinates of the grid center with shape [2]. Defaults to (0, 0).
center_loc_type (str) – Coordinate type of
center_loc. One of ‘offset’ (default), ‘axial’, or ‘euclid’.precision (Literal['single', 'double'] | None) – Precision used for internal calculations and outputs. If set to None,
precisionis used.device (str | None) – Device for computation. If None,
deviceis used.
- Inputs:
batch_size – int. Batch size.
num_ut_per_sector – int. Number of users to sample per sector and per batch.
min_bs_ut_dist – float. Minimum distance between a base station (BS) and a user [m].
max_bs_ut_dist – float | None. Maximum distance between a base station (BS) and a user [m]. If None, it is not considered.
min_ut_height – float. Minimum user height [m]. Defaults to 0.
max_ut_height – float. Maximum user height [m]. Defaults to 0.
- Outputs:
ut_loc – [batch_size, num_cells, num_sectors=3, num_ut_per_sector, 3], torch.float. Location of users, dropped uniformly at random within each sector.
mirror_cell_per_ut_loc – [batch_size, num_cells, num_sectors=3, num_ut_per_sector, num_cells, 3], torch.float. Coordinates of the artificial mirror cell centers, located at Euclidean distance
wraparound_distfrom each user.wraparound_dist – [batch_size, num_cells, num_sectors=3, num_ut_per_sector, num_cells], torch.float. Wraparound distance in the X-Y plane between each user and the cell centers.
Examples
from sionna.sys import HexGrid

# Create a hexagonal grid with a specified radius and number of rings
grid = HexGrid(cell_radius=1,
               cell_height=10,
               num_rings=1,
               center_loc=(0, 0))

# Cell center locations
print(grid.cell_loc)
# tensor([[ 0.0000,  0.0000, 10.0000],
#         [-1.5000,  0.8660, 10.0000],
#         [ 0.0000,  1.7321, 10.0000],
#         [ 1.5000,  0.8660, 10.0000],
#         [ 1.5000, -0.8660, 10.0000],
#         [ 0.0000, -1.7321, 10.0000],
#         [-1.5000, -0.8660, 10.0000]])
Attributes
- property grid: Dict[int, sionna.sys.topology.Hexagon]#
dict : Collection of
Hexagonobjects corresponding to the cells in the grid.
- property cell_loc: torch.Tensor#
[num_cells, 3], torch.float : Euclidean coordinates of the cell centers [m].
- property center_loc: torch.Tensor#
[2], int | float : Grid center coordinates in the X-Y plane, of type
center_loc_type.
- property cell_radius: torch.Tensor#
torch.float : Radius of any hexagonal cell in the grid [m].
- property isd: torch.Tensor#
torch.float : Inter-site Euclidean distance [m].
- property cell_height: torch.Tensor#
torch.float : Cell height [m].
- property mirror_cell_loc: torch.Tensor#
[num_cells, num_mirror_grids+1=7, 3], torch.float : Euclidean (x,y,z) coordinates (axis=2) of the 6 mirror + base cells (axis=1) for each base cell (axis=0).
Methods
- show(show_mirrors: bool = False, show_coord: bool = False, show_coord_type: str = 'euclid', show_sectors: bool = False, coord_fontsize: int = 8, fig: matplotlib.figure.Figure | None = None, color: str = 'b', label: str | None = 'base') matplotlib.figure.Figure[source]#
Visualizes the base hexagonal grid and, if specified, the mirror grids too.
Note that a mirror grid is a replica of the base grid, repeated around its boundaries to enable wraparound.
- Parameters:
show_mirrors (bool) – If True, then the mirror grids are visualized
show_coord (bool) – If True, then the hexagon coordinates are visualized
show_coord_type (str) – Type of coordinates to be visualized. Must be one of {‘offset’, ‘axial’, ‘euclid’}. Only effective if
show_coordis True.show_sectors (bool) – If True, then the three sectors within each hexagon are visualized
coord_fontsize (int) – Coordinate fontsize. Only effective if
show_coordis True.fig (matplotlib.figure.Figure | None) – Existing figure handle on which the grid is overlayed. If None, then a new figure is created.
color (str) – Matplotlib line color
label (str | None) – Label for the cells. If None, no label is added.
- Outputs:
fig – Figure handle