Radio Map
A radio map describes a metric, such as path gain, received signal strength (RSS), or signal-to-interference-plus-noise ratio (SINR) for a specific transmitter at every point on a plane. In other words, for a given transmitter, it associates every point on a surface with the channel gain, RSS, or SINR, that a receiver with a specific orientation would observe at this point. A radio map is not uniquely defined as it depends on the transmit and receive arrays and their respective antenna patterns, the transmitter and receiver orientations, as well as transmit precoding and receive combining vectors. Moreover, a radio map is not continuous but discrete because the plane is quantized into small rectangular bins.
In Sionna, radio maps are computed using a radio map solver which returns an instance of
RadioMap. They can be visualized by providing them either as arguments to the functions
render(), render_to_file(), and preview(),
or by using the class method show().
A very useful feature is sample_positions() which allows sampling
of random positions within the scene that have sufficient path gain, RSS, or SINR from a specific transmitter.
- class sionna.rt.RadioMap(scene, center, orientation, size, cell_size)[source]
Radio Map
A radio map is generated for the loaded scene for all transmitters using a radio map solver. Please refer to the documentation of this module for further details.
- Parameters:
scene (
sionna.rt.scene.Scene) – Scene for which the radio map is computedcenter (
mitsuba.Point3f) – Center of the radio maporientation (
mitsuba.Point3f) – Orientation of the radio mapsize (
mitsuba.Point2f) – Size of the radio map [m]cell_size (
mitsuba.Point2f) – Size of a cell of the radio map [m]
- cdf(metric='path_gain', tx=None, bins=200)[source]
Computes and visualizes the CDF of a metric of the radio map
- Parameters:
metric ("path_gain" | "rss" | "sinr") – Metric to be shown
tx (
typing.Optional[int]) – Index or name of the transmitter for which to show the radio map. If None, the maximum value over all transmitters for each cell is shown.bins (
int) – Number of bins used to compute the CDF
- Return type:
typing.Tuple[matplotlib.figure.Figure,drjit.cuda.ad.TensorXf,drjit.cuda.ad.Float]- Returns:
Figure showing the CDF
- Returns:
Data points for the chosen metric
- Returns:
Cummulative probabilities for the data points
- property cell_centers
Positions of the centers of the cells in the global coordinate system
- Type:
mi.TensorXf [num_cells_y, num_cells_x, 3]
- property cell_size
Size of a cell of the radio map [m]
- Type:
mi.Point2f
- property center
Center of the radio map in the global coordinate system
- Type:
mi.Point3f
- property num_cells
Number of cells along the local X and Y axes
- Type:
mi.Point2u
- property num_rx
Number of receivers
- Type:
int
- property num_tx
Number of transmitters
- Type:
int
- property orientation
Orientation of the radio map
- Type:
mi.Point3f
- property path_gain
Path gains across the radio map from all transmitters
- Type:
mi.TensorXf [num_tx, num_cells_y, num_cells_x]
- property rss
Received signal strength (RSS) across the radio map from all transmitters
- Type:
mi.TensorXf [num_tx, num_cells_y, num_cells_x]
- property rx_cell_indices
Computes and returns the cell index positions corresponding to receivers in the format (column, row)
- Type:
mi.Point2u
- sample_positions(num_pos, metric='path_gain', min_val_db=None, max_val_db=None, min_dist=None, max_dist=None, tx_association=True, center_pos=False, seed=1)[source]
Samples random user positions in a scene based on a radio map
For a given radio map,
num_posrandom positions are sampled around each transmitter, such that the selected metric, e.g., SINR, is larger thanmin_val_dband/or smaller thanmax_val_db. Similarly,min_distandmax_distdefine the minimum and maximum distance of the random positions to the transmitter under consideration. By activating the flagtx_association, only positions are sampled for which the selected metric is the highest across all transmitters. This is useful if one wants to ensure, e.g., that the sampled positions for each transmitter provide the highest SINR or RSS.Note that due to the quantization of the radio map into cells it is not guaranteed that all above parameters are exactly fulfilled for a returned position. This stems from the fact that every individual cell of the radio map describes the expected average behavior of the surface within this cell. For instance, it may happen that half of the selected cell is shadowed and, thus, no path to the transmitter exists but the average path gain is still larger than the given threshold. Please enable the flag
center_posto sample only positions from the cell centers.import numpy as np import sionna from sionna.rt import load_scene, PlanarArray, Transmitter,\ RadioMapSolver, Receiver scene = load_scene(sionna.rt.scene.munich) # Configure antenna array for all transmitters scene.tx_array = PlanarArray(num_rows=1, num_cols=1, vertical_spacing=0.7, horizontal_spacing=0.5, pattern="iso", polarization="V") # Add a transmitters tx = Transmitter(name="tx", position=[-195,-240,30], orientation=[0,0,0]) scene.add(tx) solver = RadioMapSolver() rm = solver(scene, cell_size=(1., 1.), samples_per_tx=100000000) positions,_ = rm.sample_positions(num_pos=200, min_val_db=-100., min_dist=50., max_dist=80.) positions = positions.numpy() positions = np.squeeze(positions, axis=0) for i,p in enumerate(positions): rx = Receiver(name=f"rx-{i}", position=p, orientation=[0,0,0]) scene.add(rx) scene.preview(clip_at=10.);
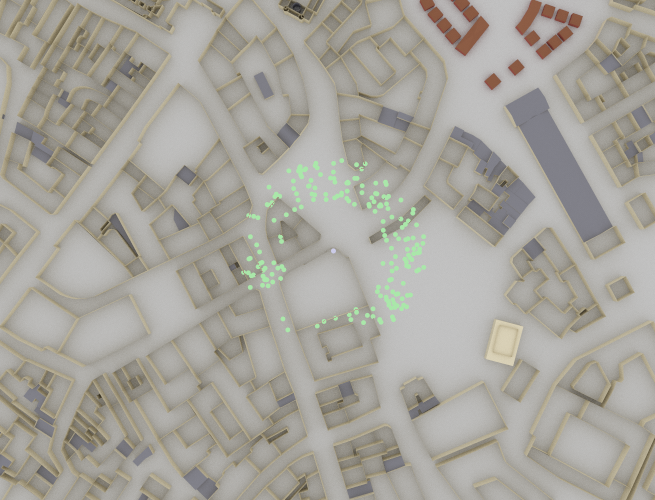
The above example shows an example for random positions between 50m and 80m from the transmitter and a minimum path gain of -100 dB. Keep in mind that the transmitter can have a different height than the radio map which also contributes to this distance. For example if the transmitter is located 20m above the surface of the radio map and a
min_distof 20m is selected, also positions directly below the transmitter are sampled.- Parameters:
num_pos (
int) – Number of returned random positions for each transmittermetric ("path_gain" | "rss" | "sinr") – Metric to be considered for sampling positions
min_val_db (
typing.Optional[float]) – Minimum value for the selected metric ([dB] for path gain and SINR; [dBm] for RSS). Positions are only sampled from cells where the selected metric is larger than or equal to this value. Ignored if None.max_val_db (
typing.Optional[float]) – Maximum value for the selected metric ([dB] for path gain and SINR; [dBm] for RSS). Positions are only sampled from cells where the selected metric is smaller than or equal to this value. Ignored if None.min_dist (
typing.Optional[float]) – Minimum distance [m] from transmitter for all random positions. Ignored if None.max_dist (
typing.Optional[float]) – Maximum distance [m] from transmitter for all random positions. Ignored if None.tx_association (
bool) – If True, only positions associated with a transmitter are chosen, i.e., positions where the chosen metric is the highest among all all transmitters. Else, a user located in a sampled position for a specific transmitter may perceive a higher metric from another TX.center_pos (
bool) – If True, all returned positions are sampled from the cell center (i.e., the grid of the radio map). Otherwise, the positions are randomly drawn from the surface of the cell.seed (int)
- Return type:
typing.Tuple[drjit.cuda.ad.TensorXf,drjit.cuda.ad.TensorXu]- Returns:
Random positions
[num_tx, num_pos, 3]) that are in cells fulfilling the configured constraints- Returns:
Cell indices (shape
[num_tx, num_pos, 2]) corresponding to the random positions in the format (column, row)
- show(metric='path_gain', tx=None, vmin=None, vmax=None, show_tx=True, show_rx=False)[source]
Visualizes a radio map
The position of the transmitters is indicated by “+” markers. The positions of the receivers are indicated by “x” markers.
- Parameters:
metric ("path_gain" | "rss" | "sinr") – Metric to show
tx (
typing.Optional[int]) – Index of the transmitter for which to show the radio map. If None, the maximum value over all transmitters for each cell is shown.vmin (
typing.Optional[float]) – Defines the minimum value [dB] for the colormap covers. If set to None, then the minimum value across all cells is used.vmax (
typing.Optional[float]) – Defines the maximum value [dB] for the colormap covers. If set to None, then the maximum value across all cells is used.show_tx (
bool) – If set to True, then the position of the transmitters are shown.show_rx (
bool) – If set to True, then the position of the receivers are shown.
- Return type:
matplotlib.figure.Figure- Returns:
Figure showing the radio map
- show_association(metric='path_gain', show_tx=True, show_rx=False)[source]
Visualizes cell-to-tx association for a given metric
The positions of the transmitters and receivers are indicated by “+” and “x” markers, respectively.
- Parameters:
metric ("path_gain" | "rss" | "sinr") – Metric to show
show_tx (
bool) – If set to True, then the position of the transmitters are shown.show_rx (
bool) – If set to True, then the position of the receivers are shown.
- Return type:
matplotlib.figure.Figure- Returns:
Figure showing the cell-to-transmitter association
- property sinr
SINR across the radio map from all transmitters
- Type:
mi.TensorXf [num_tx, num_cells_y, num_cells_x]
- property size
Size of the radio map [m]
- Type:
mi.Point2f
- tx_association(metric='path_gain')[source]
Computes cell-to-transmitter association
Each cell is associated with the transmitter providing the highest metric, such as path gain, received signal strength (RSS), or SINR.
- Parameters:
metric ("path_gain" | "rss" | "sinr") – Metric to be used
- Return type:
drjit.cuda.ad.TensorXi- Returns:
Cell-to-transmitter association
- property tx_cell_indices
Cell index position of each transmitter in the format (column, row)
- Type:
mi.Point2u